15 Jan 2026
Assessing residential property investment today
Has housing regained its investment attractiveness? What a new European Central Bank indicator shows
The residential real estate market shows signs of a gradual recovery, as indicators of investment attractiveness have improved following the sharp correction observed in recent years. Evidence from the European Central Bank’s Consumer Expectations Survey (CES) points to an increase in households’ expectations for house price developments and a decline in perceived uncertainty, although sentiment remains below the elevated levels recorded in 2021–2022. These dynamics appear to be supported by the easing of financing conditions and the gradual normalization of monetary policy, thereby suggesting conditions for a modest strengthening of housing investment going forward.
In order to capture housing investment attractiveness in a more objective manner, the ECB’s analysis makes use of the Sharpe ratio, a well-established financial indicator that links the expected return of an investment to the risk associated with it. The higher the ratio, the more attractive an investment is considered, as it offers a higher expected return for a given level of risk.
In the case of housing, the Sharpe ratio is not based on realized returns, but on households’ own expectations. Specifically, it is calculated as the difference between the expected increase in house prices over the next 12 months and the risk-free return—approximated by the one-year deposit interest rate—divided by the uncertainty reported by households regarding future price developments.
Over the past year, the housing Sharpe ratio has improved markedly, although it remains below the elevated levels observed in early 2022.
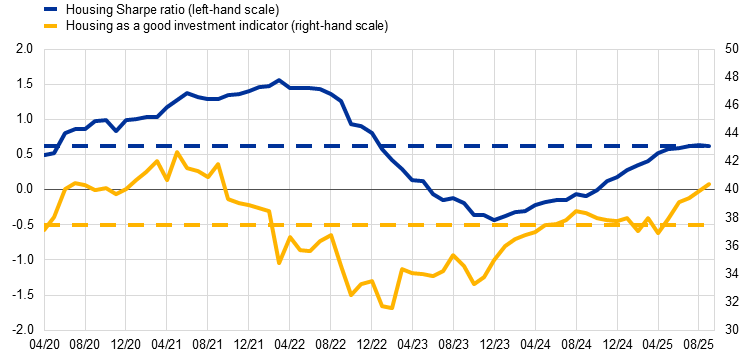
Following the COVID-19 pandemic, the indicator increased until early 2022, before declining sharply thereafter. A reversal in the trend was observed in late 2023, when the indicator began to recover steadily. By September 2025, it stood slightly above the sample average, but remained well below its previous peak.
A similar pattern is observed for the indicator measuring perceptions of housing as a good investment, defined as the share of households that currently consider the purchase of residential property in their neighbourhood to be advantageous. This indicator began to decline and recover somewhat earlier than the Sharpe ratio and, by September 2025, was likewise marginally above its historical average, though still below the levels recorded in 2021.
An analysis of the individual components of the Sharpe ratio over recent years suggests that its fluctuations have been driven primarily by changes in expectations regarding house price growth and movements in the risk-free interest rate.
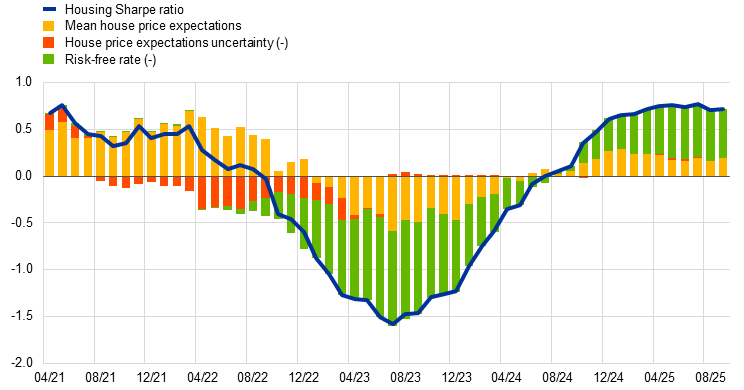
From late 2021 to mid-2023, the indicator declined sharply. Initially, heightened uncertainty regarding house prices, followed by lower expectations for price increases, weighed on the investment outlook for housing. At the same time, the increase in interest rates during the ECB’s monetary policy tightening phase exerted additional downward pressure until late 2023.
The subsequent increase in the indicator from July 2023 onwards was driven mainly by an improvement in expectations for house price growth, with a smaller contribution from declining uncertainty. In addition, it reflects a reduction in the risk-free interest rate, as monetary policy was progressively normalized in an environment of easing inflationary pressures.
Over the period from April 2020 to September 2025, the average housing Sharpe ratio exhibits substantial heterogeneity across households, depending on their demographic and economic characteristics.
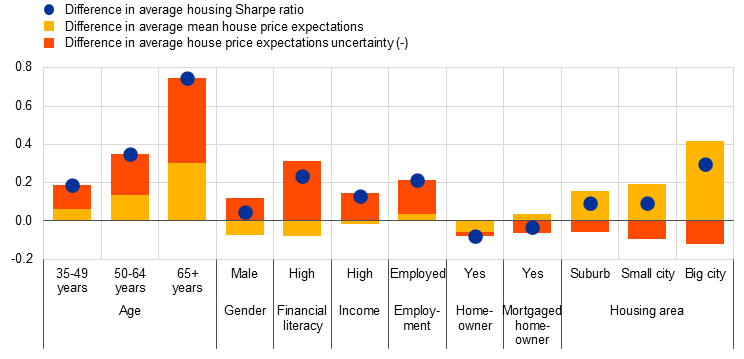
On average, higher values are observed among older, male, financially stronger, employed and more financially literate households. This mainly reflects lower uncertainty surrounding their expectations, although in some cases higher expected house price growth also plays a role.
With regard to location, households living in urban and suburban areas display higher indicators than those in rural areas, primarily owing to stronger expectations of house price increases. In addition, the indicator is generally lower for owner-occupiers than for renters, reflecting lower average expectations. However, among owner-occupiers, no material difference is observed between those owning their dwelling outright and those with an outstanding mortgage.
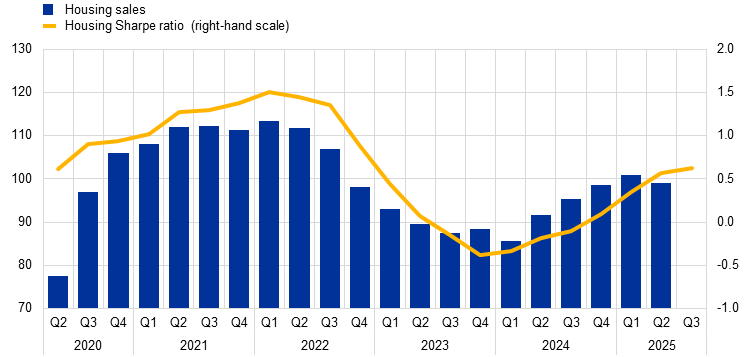
Overall, the housing Sharpe ratio points to a further, albeit moderate, recovery in housing investment. A comparison of the indicator’s evolution with actual housing transactions reveals a close co-movement between the two variables, reinforcing its usefulness as a monitoring tool for housing market developments.
More specifically, the increase in the indicator up to September 2025 suggests that housing sales are likely to continue rising following the slight decline observed in the second quarter. This development is expected to support the short-term outlook for both housing investment and household spending on durable goods related to housing, which typically move in line with housing market activity.